I remember the first time I sat in front of a messy dataset with no idea where to start. There were thousands of rows, inconsistent formats, and a stakeholder asking for “insights by Friday.” I made every mistake possible — I skipped planning, jumped straight into analysis, and ended up presenting numbers that raised more questions than answers.
That experience taught me one thing: data analytics without a structured life cycle is just guesswork with spreadsheets.
Whether you’re just getting started in data analytics or you’re a seasoned analyst trying to improve your workflow, understanding the data analytics life cycle is non-negotiable. It’s the backbone of every successful data project — from a simple sales dashboard to a complex machine learning pipeline.
In this guide, I’ll walk you through every phase of the data analytics life cycle, explain what actually happens at each stage (not just theory), and share the mistakes most people make along the way.
A visual diagram showing all 6 phases of the data analytics life cycle in a circular flow — great for featured snippet targeting]
What Is the Data Analytics Life Cycle?
The data analytics life cycle is a structured, repeatable process that organizations follow to turn raw data into meaningful business insights. Think of it as a project management framework specifically designed for data work.
It’s not a one-time thing. It’s a cycle — meaning once you finish one round of analysis, the insights you gain often feed the next question, and the process begins again.
The life cycle typically includes six core phases:
Discovery
Data Preparation
Model Planning
Model Building
Communication
Operationalization
Some frameworks call these phases by different names, and a few models add or combine steps. But the core idea stays the same: plan before you analyze, and document as you go.
The 6 Phases of the Data Analytics Life Cycle (Explained)
Phase 1: Discovery
This is where most analysts underinvest their time — and where most projects go wrong.
Discovery is about understanding the business problem before touching any data. You’re answering questions like:
What problem are we actually trying to solve?
What does success look like?
What data might we need?
Who are the stakeholders, and what do they actually care about?
In practice, this means sitting down with business teams, asking uncomfortable questions, and challenging assumptions. I’ve worked on projects where the “data problem” turned out to be a process problem — and we saved weeks of work by figuring that out in week one.
Key activities in Discovery:
Define project objectives and KPIs
Identify available data sources
Assess existing analytics capabilities
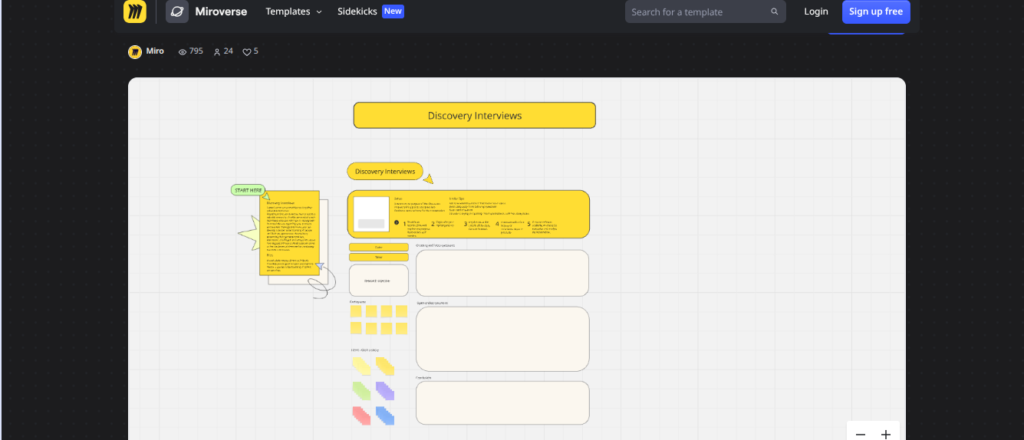
Conduct stakeholder interviews
Establish success metrics
Phase 2: Data Preparation
This phase is unglamorous. It’s also where you’ll spend the most time — studies consistently show analysts spend 60–80% of their time just cleaning and preparing data.
Data preparation (also called data wrangling or data preprocessing) involves:
Data collection — pulling data from databases, APIs, spreadsheets, or third-party tools
Data cleaning — fixing missing values, removing duplicates, correcting errors
Data transformation — reshaping data into formats suitable for analysis
Data integration — merging data from multiple sources into one coherent dataset
Data validation — confirming that your data is accurate and complete
One practical tip I swear by: always keep a copy of the raw, unmodified data. Document every transformation you make. Future-you will thank present-you when something breaks.
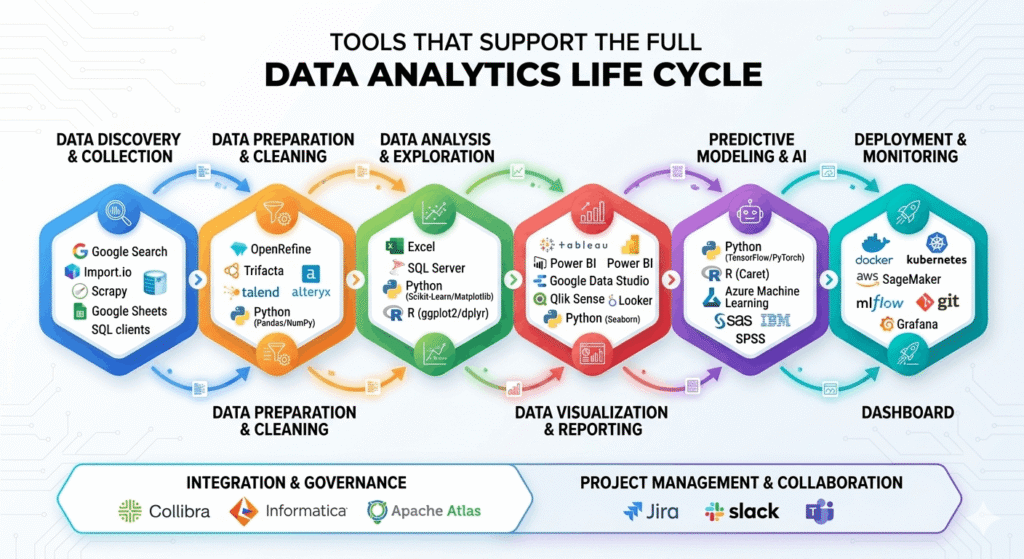
Popular tools at this stage: Python (Pandas), SQL, Excel Power Query, dbt, Talend, Apache Spark
Phase 3: Model Planning
Here’s where analysts start thinking about how they’ll extract insights from clean data.
Model planning doesn’t always mean building a machine learning model. For many projects, it simply means choosing the right analytical approach — whether that’s a regression analysis, a cohort analysis, clustering, or just a well-structured pivot table.
Questions to answer in model planning:
What type of analysis fits the business question? (descriptive, diagnostic, predictive, prescriptive)
What variables are most important?
Do we have enough data to get statistically meaningful results?
What are the risks of bias in the dataset?
This is also the stage where you think about feature engineering — creating new variables from existing data that might improve your analysis. For example, converting raw timestamps into “day of week” or “time since last purchase.”
Phase 4: Model Building
Now the real work begins.
Model building is where you execute the analytical or machine learning approach you planned. This could mean:
Running statistical tests
Training a predictive model
Building a clustering algorithm
Creating a complex SQL query that segments your customer base
In my experience, most analysts rush here. They want to get to the “interesting” part. But a model built on a weak plan and dirty data will give you confident-sounding wrong answers — which is worse than no answer at all.
Best practices for model building:
Start simple before going complex
Split your data into training and validation sets (for ML models)
Document your assumptions
Test for overfitting and bias
Version-control your code (use Git — always)
Popular tools: Python (scikit-learn, TensorFlow), R, SAS, Azure ML, Google Vertex AI
Phase 5: Communication
You could build the most accurate model in the world. If you can’t explain it to a non-technical stakeholder, it’s worthless.
Communication is about translating your findings into clear, actionable insights for your audience. This means:
Choosing the right visualization for your data
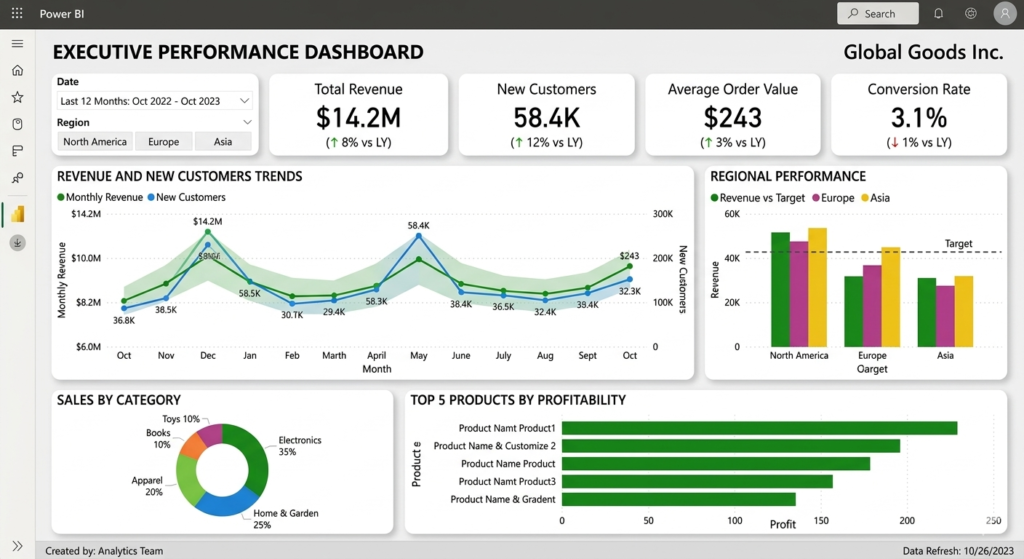
Building dashboards that tell a story (not just show numbers)
Writing executive summaries that get to the point fast
Presenting recommendations, not just findings
One hard lesson I learned: stakeholders don’t care how you built the model. They care what it means for their decisions.
Always structure your communication around: “Here’s what we found → here’s why it matters → here’s what we recommend.”
Tools for data communication: Tableau, Power BI, Looker, Google Data Studio, matplotlib/seaborn (Python), Canva for non-technical presentations
Phase 6: Operationalization
This is the phase most tutorials skip — and it’s arguably the most important for long-term business value.
Operationalization means taking your analysis out of a notebook or slide deck and embedding it into real business processes. This could mean:
Deploying a predictive model into a production system
Setting up automated reporting pipelines
Creating dashboards that refresh with live data
Training team members to use new analytics tools
Establishing monitoring to catch when models drift or degrade
A model that runs once and lives in a PowerPoint is a project. A model that runs automatically and drives decisions every day is an asset.
Key considerations in operationalization:
Who owns this system going forward?
How will you monitor performance over time?
What’s the retraining or update schedule?
How will you handle data pipeline failures?
Data Analytics Life Cycle: Quick Reference Table
Phase
Key Goal
Common Tools
Time Investment
Discovery
Define the problem
Miro, Confluence, interviews
10–15%
Data Preparation
Clean and structure data
Python, SQL, dbt
40–60%
Model Planning
Choose analytical approach
Jupyter, whiteboards
5–10%
Model Building
Execute analysis or ML
Python, R, SAS, Spark
15–20%
Communication
Share insights clearly
Tableau, Power BI, slides
10–15%
Operationalization
Embed into business processes
Airflow, MLflow, APIs
10–20%
Data Analytics Life Cycle vs. Data Science Life Cycle
People often confuse these two. Here’s a simple breakdown:
Aspect
Data Analytics Life Cycle
Data Science Life Cycle
Primary focus
Business insights from existing data
Predictive/prescriptive modeling
Main users
Analysts, BI teams
Data scientists, ML engineers
Output
Reports, dashboards, recommendations
Models, algorithms, automated predictions
Complexity
Low to medium
Medium to very high
Timeframe
Days to weeks
Weeks to months
Tools
SQL, Excel, Tableau, Power BI
Python, R, TensorFlow, Spark
Both follow a similar structured approach, but data science typically involves more statistical modeling and machine learning — and a longer development cycle.
Common Mistakes at Each Phase (And How to Avoid Them)
Discovery mistakes:
Jumping to solutions before understanding the problem
Not involving the right stakeholders early enough
Setting vague success criteria
Data Preparation mistakes:
Modifying the original raw data
Ignoring outliers without documenting why
Merging datasets without checking join logic
Model Planning mistakes:
Picking the most complex model when a simple one would do
Ignoring selection bias in your dataset
Model Building mistakes:
Over-fitting to training data
Not testing on a holdout dataset
Skipping reproducibility (not using version control)
Communication mistakes:
Using technical jargon with non-technical audiences
Showing charts without explaining what they mean
Presenting findings without clear recommendations
Operationalization mistakes:
No monitoring or alerting on deployed models
No documentation for the team who inherits the system
Treating deployment as the finish line
Pros and Cons of Following a Formal Data Analytics Life Cycle
Pros
Reduces wasted work and rework
Ensures alignment between analysts and business stakeholders
Improves reproducibility and documentation
Makes it easier to onboard new team members
Builds confidence in results because process is transparent
Cons
Can feel slow for quick ad-hoc analyses
Adds overhead to simple reporting tasks
Requires buy-in from stakeholders (not always easy)
May be overkill for one-off questions
Verdict: For any project that takes more than a day or that will inform a significant decision, use the life cycle. For a quick “what were our sales last Tuesday?” question, skip the formality.
Let me walk through how the life cycle plays out in a real scenario.
Discovery: An e-commerce company notices revenue is flat despite steady new customer acquisition. The question: are existing customers churning at a higher rate?
Data Preparation: Pull 18 months of purchase history, clean it to remove test accounts and returns, and define “churned” as no purchase in 90 days.
Model Planning: Decide on a logistic regression to predict churn probability, with cohort analysis to understand when customers typically churn.
Model Building: Train the model on the first 12 months, validate on the last 6. Identify the top predictors: second purchase within 14 days, email open rate, product category.
Communication: Present to the marketing team: “Customers who don’t make a second purchase within 14 days have a 73% churn rate. A targeted email sequence on Day 7 could recover 15–20% of these customers.”
Operationalization: Deploy the churn score to the CRM. Set up automated email triggers. Schedule monthly model retraining.
That’s the life cycle in action — not as abstract theory, but as a real workflow that produces real business value.
End-to-end platforms:
Databricks — handles data prep, modeling, and deployment
Azure Synapse Analytics — integrates data warehouse with analytics
Google Cloud Vertex AI — ML-focused but covers the full cycle
AWS SageMaker — strong for model building and operationalization
Best-in-class point solutions:
dbt for data transformation
Jupyter Notebooks for exploratory analysis
MLflow for model tracking and deployment
Tableau/Power BI for communication
Airflow for pipeline orchestration
Frequently Asked Questions (FAQ)
What is the data analytics life cycle?
The data analytics life cycle is a structured, repeatable process that guides data projects from initial problem definition through to deployment of insights into business operations. It typically includes six phases: discovery, data preparation, model planning, model building, communication, and operationalization.
How many phases are in the data analytics life cycle?
Most frameworks describe six phases, though some models use five or seven depending on how steps are grouped. The core activities — understanding the problem, preparing data, planning and building the analysis, communicating results, and deploying — are consistent across all frameworks.
What is the most time-consuming phase of the data analytics life cycle?
Data preparation consistently takes the most time — typically 40–60% of the total project time. Cleaning, transforming, and validating data is unglamorous but critical. Poor data preparation undermines every downstream phase.
Is the data analytics life cycle the same as the data science life cycle?
They overlap significantly but aren’t identical. The data analytics life cycle focuses on extracting insights from existing data, usually for reporting and decision support. The data science life cycle places more emphasis on building and deploying predictive models and algorithms.
Can small teams use the data analytics life cycle?
Absolutely. You don’t need a dedicated data team to follow the life cycle — you just need to be intentional about each phase. Even a solo analyst can follow a lightweight version: define the question, prep the data, choose the approach, build the analysis, communicate clearly, and think about how the result will be used.
What happens if you skip the discovery phase?
Skipping discovery is the most common cause of analytics project failure. Without clearly defining the business problem and success metrics upfront, you risk spending weeks building analysis that answers the wrong question. Discovery is the cheapest insurance you can buy.
How does the data analytics life cycle relate to data governance?
Data governance — policies around data quality, access, privacy, and ownership — enables every phase of the life cycle. Good governance ensures that the data used in analysis is trustworthy, compliant, and consistently defined across the organization.
Conclusion
The data analytics life cycle isn’t bureaucracy for its own sake. It’s a battle-tested framework that separates analysts who consistently produce value from those who produce noise.
Every phase matters. Discovery keeps you working on the right problem. Data preparation ensures your results are trustworthy. Model planning keeps you from overcomplicating things. Model building turns clean data into insight. Communication makes sure insights drive action. Operationalization ensures none of that work gets lost on a slide deck.
Whether you’re a beginner trying to structure your first real project or a senior analyst looking to improve your team’s process — the life cycle gives you a foundation to build on.
Start with discovery. Define your success metrics before you write a single line of code. And remember: the goal was never to analyze data. The goal was always to make better decisions.
Want to Rank Higher on Google?
We build premium white-hat backlinks that actually move the needle. Trusted by 500+ brands.
Fazilat zulfiqar is an SEO specialist at RankWithLinks, focused on improving search rankings through smart link building and optimization.He helps businesses grow organic traffic and build strong online authority.
Ready to Increase Your Organic Traffic?
Stop buying links that don't move the needle. Get high DA backlinks with full-scale SEO implementation
included.

![A visual diagram showing all 6 phases of the data analytics life cycle in a circular flow — great for featured snippet targeting]](https://rankwithlinks.com/wp-content/uploads/2026/05/image_6b720f24-1.png)
![cleaned dataset in python/pandas]](https://rankwithlinks.com/wp-content/uploads/2026/05/image-184-1024x423.png)
![A sample model evaluation report showing accuracy metrics — precision, recall, F1 score]](https://rankwithlinks.com/wp-content/uploads/2026/05/image_c12d02f1-1-1024x559.png)