
Introduction: The Report That Almost Cost Me a Client
Three years into running SEO campaigns, I thought I was delivering great reports.
Forty-page PDFs. Every metric I could pull from Google Search Console, Ahrefs, Semrush, and GA4. Crawl errors, backlink profiles, keyword rankings, Core Web Vitals — all of it, every month, without fail.
Then one client said something that stopped me cold.
“I read your reports every month and I still have no idea if our SEO is actually working.”
That hit hard. Because I had been reporting everything. Just not the things that mattered to her.
She did not care about domain authority trends or crawl budget. She cared about whether more people were finding her business, calling her, and buying from her.
That conversation changed how I build every SEO report. And in this guide, I am going to share exactly what should go into an SEO report that actually communicates value — not just data.
Key Takeaways
- A great SEO report tells a story, it does not just dump data
- Always start with business impact, not technical metrics
- Include organic traffic, keyword rankings, conversions, and technical health at minimum
- Tailor every report to the audience — clients need different views than developers
- Monthly reports work for most clients — weekly is too frequent, quarterly is too slow
- Visualize trends over time, not just snapshots
- Always include a “what we did” and “what we will do next” section
- Use Google Looker Studio for scalable, professional reporting
Why Most SEO Reports Fail
Before we cover what to include, let us address why most reports fall short.
The biggest mistake is treating an SEO report like a data export. You log into your tools, pull the numbers, paste them into a template, and send it off. Job done.
But raw data without context is noise. A client seeing “organic sessions down 12% this month” without explanation will panic. The same client seeing “organic sessions down 12% this month due to seasonal drop consistent with last year’s pattern — compare March 2025 vs March 2026” will feel confident.
The second biggest mistake is reporting vanity metrics. Rankings for keywords that never convert. Traffic from countries you do not sell in. Impressions with no corresponding click data.
A strong SEO report is not about proving you are busy. It is about proving your work is moving the business forward.
Who Is Reading Your SEO Report?
Before you build the report, define your audience. This single step changes everything about what you include.
| Audience | What They Care About | What to Include |
|---|---|---|
| Business owner / CEO | Revenue, leads, growth | Conversions, traffic value, ROI |
| Marketing manager | Campaign performance, channel comparison | Traffic sources, keyword growth, content performance |
| Developer / tech team | Site health, crawl issues, speed | Core Web Vitals, crawl errors, indexing status |
| E-commerce manager | Product visibility, shopping traffic | Product keyword rankings, shopping impressions |
| In-house SEO team | Full technical and strategic picture | Everything, with deep trend analysis |
If you are sending the same report to all of these people, you are doing it wrong. Build different views for different stakeholders — or at minimum, lead with what matters most to the specific reader.
What Should I Include in My SEO Report: The 10 Core Sections
1. Executive Summary
This is the most important section and the most skipped one.
Every SEO report should open with a short, plain-English summary of what happened this period. Three to five sentences maximum. Write it last, after you have reviewed all the data.
A good executive summary answers:
- Did organic performance improve, decline, or hold steady?
- What was the main driver of any change?
- Is there anything urgent the client needs to know?
Example:
“Organic traffic grew 18% month over month, driven primarily by four new articles published in February now ranking on page one. Leads from organic search increased by 11%. One technical issue — a misconfigured redirect chain on the services page — was identified and resolved this month. Next month we are focusing on building backlinks to three high-priority service pages.”
That is all a CEO needs to read. Everything else in the report is supporting evidence.
2. Organic Traffic Overview
This section shows the overall health of your organic channel.
What to include:
- Total organic sessions for the reporting period
- Comparison to the previous period (month over month)
- Comparison to the same period last year (year over year — always more meaningful for seasonal businesses)
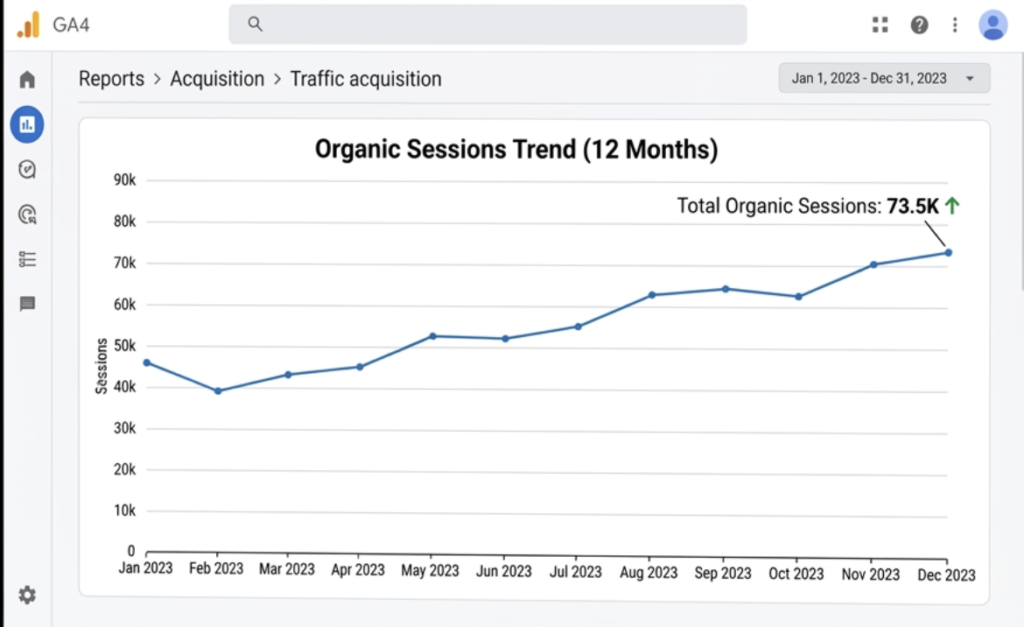
- Traffic trend chart showing the last 6 to 12 months
- Breakdown by device (desktop, mobile, tablet)
- Breakdown by country or region if relevant
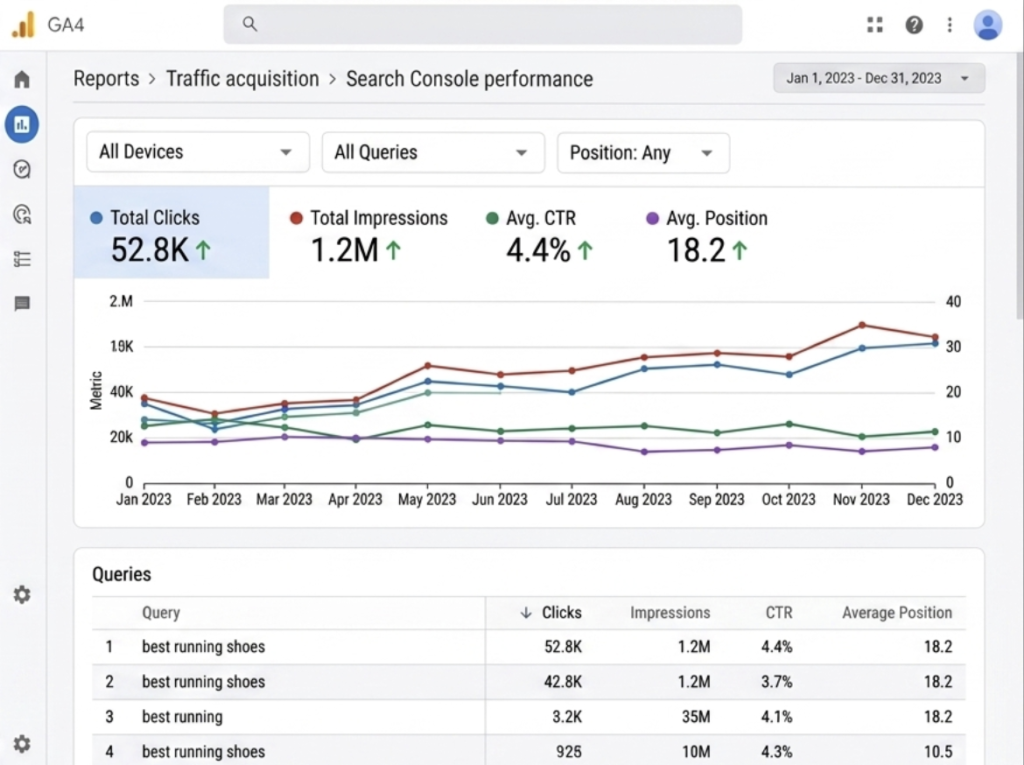
Where to pull this data: Google Analytics 4, Google Search Console
Pro tip: Always show year-over-year comparisons alongside month-over-month. A 10% month-over-month drop looks alarming. The same drop against a year-over-year gain of 35% tells a completely different story.
[Screenshot suggestion: GA4 organic traffic trend chart showing 12-month view with annotations for major changes]
3. Keyword Rankings
Keyword ranking data shows whether your content is gaining or losing visibility for the terms that matter.
What to include:
- Rankings for your target keywords (top 10, top 20, top 50 tracked keywords)
- Position changes since last report (up, down, new entries)
- New keywords entering top 10 or top 3
- Keywords that have dropped significantly
- Featured snippet wins or losses
- Average position trend over time
What not to include:
Do not dump 500 keyword rankings into a spreadsheet tab and call it reporting. Nobody reads that. Pick the keywords that matter to the business and report on those specifically.
Comparison: Keyword Reporting Approaches
| Approach | Pros | Cons |
|---|---|---|
| Track all keywords | Complete picture | Overwhelming, hard to act on |
| Track top 20-50 priority keywords | Focused, actionable | May miss emerging opportunities |
| Track by topic cluster | Shows topical authority growth | Requires more setup time |
| Track only conversion keywords | Directly tied to business value | Misses top-of-funnel visibility |
The best approach combines priority keyword tracking with topic cluster visibility — showing both conversion potential and brand awareness growth.
Where to pull this data: Google Search Console, Ahrefs, Semrush, Moz
4. Organic Conversions and Goal Completions
This is the section that justifies your entire retainer.
Traffic means nothing if it does not convert. Every SEO report must connect organic visits to business outcomes.
What to include:
- Total conversions from organic search (leads, sign-ups, purchases, calls)
- Conversion rate from organic traffic
- Revenue attributed to organic search (for e-commerce)
- Top converting landing pages from organic traffic
- Assisted conversions — organic pages that contributed to a conversion path
- Comparison to previous period
Setting this up: You need GA4 goals or conversions properly configured. If your client does not have conversion tracking set up, this is your first priority before anything else. No conversion data means you cannot prove ROI.
[Screenshot suggestion: GA4 conversion report filtered by organic traffic source, showing goal completions by landing page]
5. Top Performing Pages
This section shows which pages are driving the most organic value.
What to include:
- Top 10 pages by organic sessions
- Top 10 pages by organic conversions
- Pages with the biggest traffic gains this period
- Pages with significant traffic drops (needs investigation)
- Average engagement time on top pages
- Bounce rate trends on key landing pages
Why this matters: Understanding which pages perform best tells you where to invest. If a service page is ranking on page two and driving high conversions, it deserves priority link building and content updates. If a blog post is getting huge traffic but zero conversions, it might need a better CTA or internal link to a conversion page.
6. Technical SEO Health
This section covers the behind-the-scenes health of the website.
What to include:
- Crawl errors (404s, redirect chains, server errors)
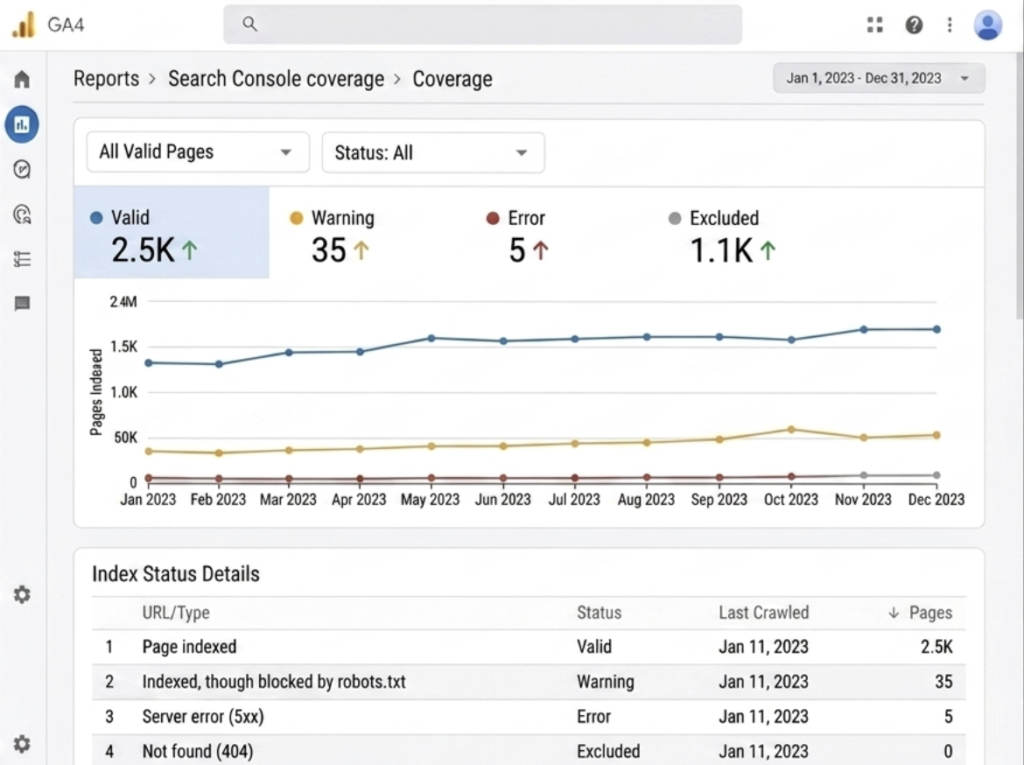
- Index coverage — how many pages are indexed vs. submitted
- Core Web Vitals scores (LCP, INP, CLS) for mobile and desktop
- Page speed performance trends
- Mobile usability issues
- Any manual actions or security issues in Search Console
- New issues discovered since the last report
- Issues resolved since the last report
How to present it: Non-technical clients do not need to know what a crawl error is at a deep level. They need to know: “We found 12 broken links on your site this month. We fixed 9 of them. The remaining 3 require a developer to update the redirect. Here is what we need from you.”
Translate technical issues into plain business language. Always.
[Screenshot suggestion: Google Search Console Coverage report showing indexed pages and any errors flagged]
7. Backlink Profile
Links remain one of Google’s top three ranking factors. Your report should show the health and growth of the backlink profile.
What to include:
- Total referring domains (not just total backlinks — domains matter more)
- New referring domains gained this period
- Lost referring domains this period
- Domain Rating or Domain Authority trend
- Top new backlinks by quality and relevance
- Any toxic or spammy links discovered
- Links built through your outreach efforts this period
What to avoid: Reporting total backlink count as a headline metric. One site with 500 links from 10 domains is far weaker than a site with 500 links from 400 domains. Always lead with referring domains.
Where to pull this data: Ahrefs, Semrush, Moz, Google Search Console (partial)
8. Content Performance
If you are producing content as part of the SEO strategy, it needs its own reporting section.
What to include:
- New content published this period
- Performance of recently published content (early ranking signals, impressions, clicks)
- Content updates completed and their performance impact
- Top performing content by traffic and engagement
- Content gaps identified for next period
- Internal linking improvements made
Expert tip: Show a before-and-after for any content that was updated or optimized. “This page was averaging 45 clicks per month. After updating in February it is now averaging 210 clicks per month.” That is a tangible result that clients remember.
9. Competitor Visibility Snapshot
A brief competitor section adds strategic context to your report.
What to include:
- Visibility comparison for your top 3 to 5 competitors
- Keywords where competitors are outranking you (opportunities)
- Keywords where you are outranking competitors (wins to protect)
- Any notable competitor content or backlink activity
- Market share of voice in your primary keyword categories
This does not need to be a full competitor audit every month. A brief snapshot showing whether you are gaining or losing ground relative to competitors is enough.
Where to pull this data: Semrush, Ahrefs, Sistrix
[Screenshot suggestion: Semrush or Ahrefs visibility comparison chart showing your site vs top 3 competitors over 6 months]
10. Actions Completed and Next Steps
This is the section that separates a good SEO agency from a great one.
Every report should end with two clear lists:
What we did this month:
- Published 3 new blog articles targeting informational keywords
- Fixed 9 broken internal links
- Built 6 new backlinks from relevant industry sites
- Updated meta descriptions on 15 pages
- Resolved Core Web Vitals issue on mobile homepage
What we will do next month:
- Publish 4 new articles targeting commercial keywords
- Begin outreach campaign for 3 priority service pages
- Fix remaining redirect chain issues with developer
- Optimize top 5 pages for featured snippet opportunities
- Conduct full site crawl after planned CMS update
This section proves you have a plan. It sets expectations. And it gives the client something concrete to look forward to in the next report.
Pros and Cons of Common SEO Reporting Tools
| Tool | Pros | Cons | Best For |
|---|---|---|---|
| Google Looker Studio | Free, visual, shareable, live data | Setup takes time | Agencies with multiple clients |
| Google Search Console | Free, direct Google data | Limited historical data, no conversion tracking | All sites, essential baseline |
| Ahrefs | Deep backlink and keyword data | Expensive, data can differ from GSC | Agencies and advanced SEOs |
| Semrush | All-in-one platform, competitor data | Expensive, overwhelming for beginners | Full-service SEO teams |
| GA4 | Full user behavior and conversion data | Complex setup, steep learning curve | All sites that need conversion tracking |
| AgencyAnalytics | Purpose-built for client reporting | Monthly cost, less data depth | Agencies wanting automated reports |
| Moz Pro | Good for beginners, clean interface | Less data depth than Ahrefs/Semrush | Small agencies, in-house beginners |
How Often Should You Send SEO Reports?
| Frequency | Best For | Risk |
|---|---|---|
| Weekly | Active campaigns, first 90 days, high-stakes clients | Too granular, too much noise in data |
| Monthly | Most ongoing retainers | Standard and recommended for most clients |
| Quarterly | Long-term strategic clients, executive summaries | Too infrequent for active campaign management |
| Real-time dashboard | Tech-savvy clients who want constant access | Can cause unnecessary panic over normal fluctuations |
Monthly is the sweet spot for most SEO engagements. It gives enough time for meaningful data to accumulate while keeping clients regularly informed.
Common SEO Reporting Mistakes to Avoid
Reporting without context. Numbers without explanation cause confusion and erode trust. Every significant change needs a reason.
Leading with technical metrics. Most clients do not care about crawl budget. Lead with traffic, conversions, and revenue.
Comparing to the wrong period. Month-over-month comparisons look terrible in seasonal businesses. Always show year-over-year for seasonal industries.
Ignoring negative trends. Hiding bad news in the back of a report or burying it in footnotes destroys trust when clients eventually notice. Address problems directly, with your plan to fix them.
No clear next steps. A report without action items is just a history lesson. Tell clients what you are doing about what you found.
Making reports too long. A 50-page report gets skimmed. A focused 8 to 12 page report gets read. Quality over quantity always.
Expert Tips for Better SEO Reports in 2026
Tip 1: Annotate your charts. When you see a traffic spike or drop, add an annotation showing what happened. Algorithm update, new content published, site migration — annotations turn raw charts into narrative.
Tip 2: Build a live dashboard alongside the monthly report. Use Google Looker Studio to give clients real-time access between reports. It reduces check-in emails and builds trust.
Tip 3: Use percentage changes alongside absolute numbers. “Traffic increased by 340 sessions” means little. “Traffic increased by 340 sessions — a 22% improvement” means something.
Tip 4: Include a traffic value estimate. Take your organic traffic and multiply it by the average CPC for your keywords. Showing a client “your organic traffic this month is worth an estimated $4,200 in paid search equivalent” makes the value of SEO tangible.
Tip 5: Segment new content performance separately. New content takes 3 to 6 months to rank properly. If you mix new content performance with established page performance, you dilute the picture. Show them separately.
FAQ: What Should I Include in My SEO Report
Q: What should I include in my SEO report?
A strong SEO report should include an executive summary, organic traffic overview, keyword ranking changes, organic conversions, top performing pages, technical SEO health, backlink profile updates, content performance, a brief competitor snapshot, and a clear list of actions completed and next steps planned.
Q: How long should an SEO report be?
For most monthly client reports, 8 to 12 pages is ideal. Executive clients may prefer a 2 to 3 page summary. Technical teams may need a more detailed version. The goal is clarity, not volume.
Q: What is the most important metric in an SEO report?
Organic conversions and conversion rate are the most important metrics because they directly connect SEO work to business outcomes. Traffic and rankings matter, but they are inputs — conversions are the output that justify the investment.
Q: How do I show ROI in an SEO report?
Calculate traffic value by multiplying organic sessions by the average cost-per-click for your target keywords. Track leads and revenue from organic traffic in GA4. Compare organic acquisition cost against paid search costs for the same results.
Q: What tools should I use to build SEO reports?
Google Looker Studio for visualization and client dashboards, Google Search Console and GA4 for core data, Ahrefs or Semrush for keyword rankings and backlink data. AgencyAnalytics is a strong option for agencies managing multiple client reports.
Q: Should I include competitor data in my SEO report?
Yes, but keep it concise. A brief monthly snapshot showing whether you are gaining or losing visibility relative to your top competitors adds strategic context without overwhelming the report.
Q: How do I explain a traffic drop in an SEO report?
Always investigate before reporting. Check for algorithm updates, technical issues, seasonal patterns, and competitor changes. Then explain the likely cause, what you have confirmed, and what action is being taken. Never leave a drop unexplained.
Conclusion: Report Less, Communicate More
The best SEO report I ever delivered was four pages long.
Executive summary. Traffic and conversions. Top keyword wins. Three things we fixed. Three things we are doing next month.
The client called me the same day she received it. “This is the first report I have actually understood in two years of working with SEO agencies.”
That is the goal. Not to impress with volume. Not to justify your hours with endless data tables. But to clearly communicate that you understand what matters to the business, you are making progress toward it, and you have a plan for what comes next.
Start with your executive summary. Build around business outcomes. Explain every significant change. End with clear next steps.
Do that every month and your clients will never question the value of SEO again.
Fazilat zulfiqar is an SEO specialist at RankWithLinks, focused on improving search rankings through smart link building and optimization.He helps businesses grow organic traffic and build strong online authority.